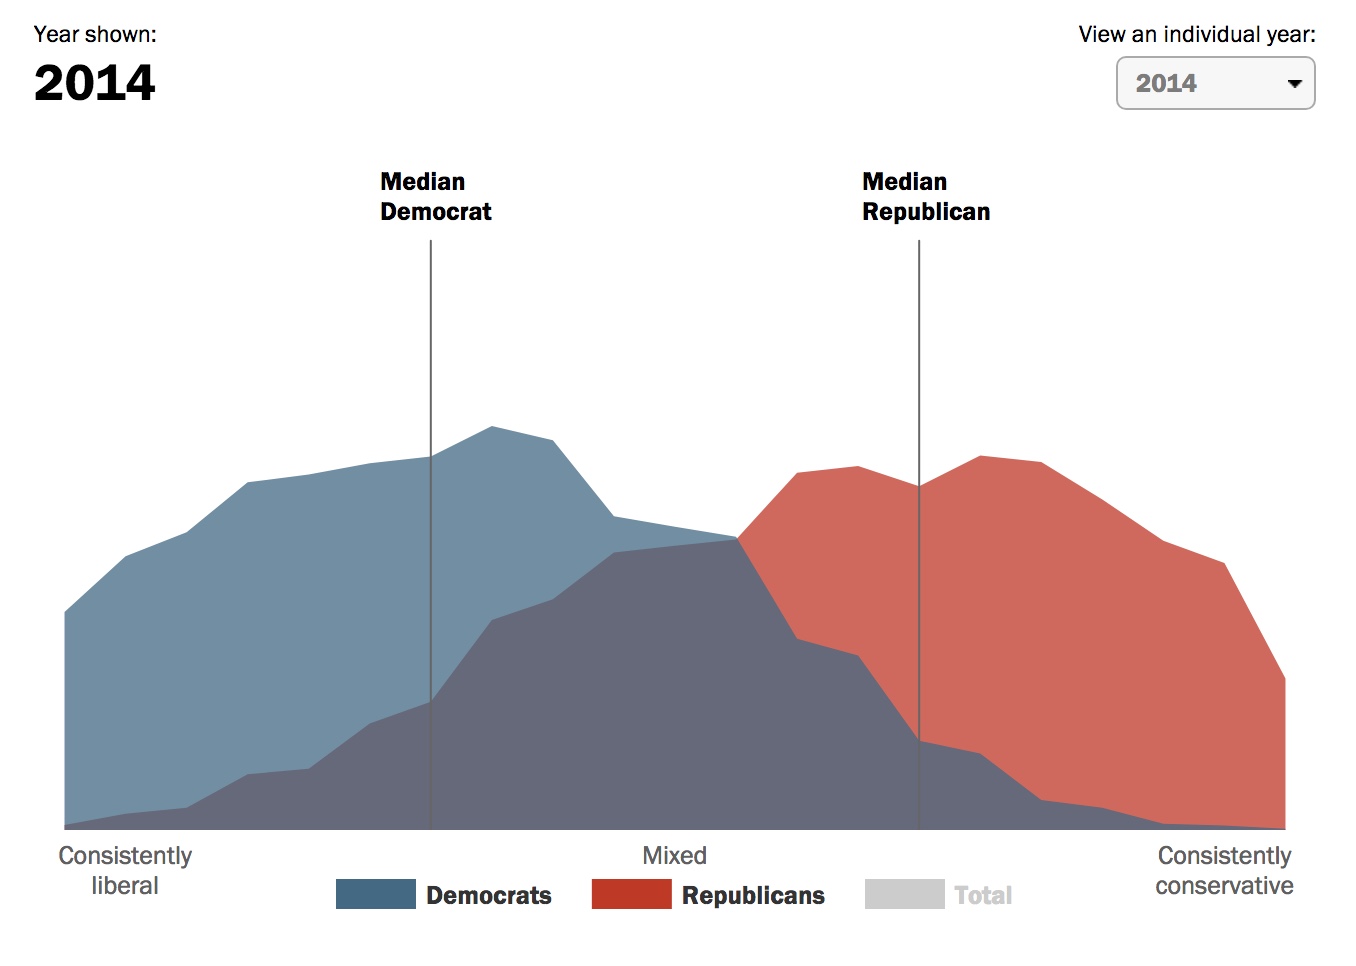
The Pew Research Center put together a fascinating interactive chart showing how the US has become more polarized over time. A couple of points of interest to me… after the graphic.

Here’s what I found especially interesting:
- Twenty years ago, there was enormous overlap between the two main parties in terms of political views. In 1994 23% of Republicans were more liberal than the median Democrat; 17% of Democrats were more conservative than the median Republican.
- That overlap has shrunk tremendously over time. Today, only 4% of Republicans are more liberal than the median Democrat, and only 5% of Democrats are more conservative than the median Republican.
- Both Democrats and Republicans shifted to the left from 1994 to 2004. After that, Democrats shifted further to the left while Republicans high-tailed it to the right.
- The politically active (Democrats and Republicans) are leading the way in terms of greater polarization.
Check out the Pew Research Center’s compelling, gripping findings here.